…NOAA Travel Time Map for 1946 Tidal Wave…
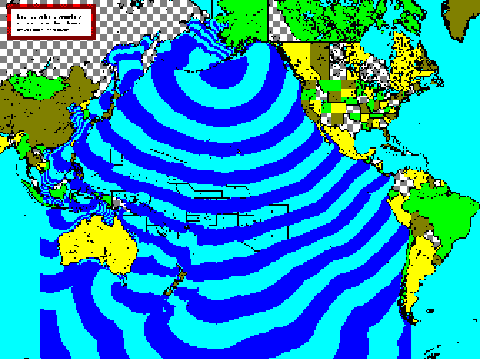
Time Travel Map from NOAA, click here
Each color band boundary represents a 1 hour tsunami travel time increment

This entry was posted
on Sunday, December 23rd, 2007 at 5:17 pm and is filed under Uncategorized.
You can follow any responses to this entry through the RSS 2.0 feed.
Both comments and pings are currently closed.